
MARKET AND TECHNOLOGY TRENDS IN THE BROADCASTING SECTOR 2015
Like so many facets of the modern world, television has been transformed by the application of digital technologies and the parallel and related development of the fast evolving Internet. While some broadcasters – especially those in developing economies — still utilise traditional analogue transmission techniques, most have transitioned to more efficient and powerful digital means of sending their programming to viewers. Use of digital technologies has enabled explosive growth in the number of channels and choices of programmes offered. It has also ceded more control to the viewer, allowing on-demand access to programming – not only from broadcasters and pay TV service providers, but also increasingly from online video services delivered over the open Internet. Indeed, as this report outlines, the definitional boundaries between broadcasting and other forms of digital video delivery are increasingly blurred.
The viewer is undoubtedly a winner as a result of these developments as we move ever closer to the ultimate provision of ubiquitous choice, convenience and control. And broadcasters are usually winners too as evidenced by the impressive global TV market growth described in this report. Inevitably, that growth and technological development is not evenly distributed geographically, and we outline some of the key regional trends in the pages that follow, as well as some more focused snapshots of the market evolution within selected countries.
However, this report also highlights a paradox at the heart of this technological revolution; namely, that the ceding of ever more control to the viewer also inevitably means an increasing risk that broadcasters lose control of their programming. It becomes harder and harder to prevent unauthorised access to the copyrighted content that traverses the globe at lightning speeds as digital ‘bits’. This poses an ever greater threat to the economics of intellectual property that sustain the broadcast and related industries.
Executive Summary
Television has been transformed by the emergence of digital technologies and the internet. However, while the online TV sector has been growing since 2009, traditional pay TV still accounts for the majority of TV revenues. Television has remained similarly resilient in the advertising market, where it maintains the highest share of advertising revenue across all media. Online video is currently growing complementarily to TV advertising, but some cannibalization is starting to be observed in the European Nordic region.
Television and video delivery platforms are becoming increasingly complex as viewing preferences move towards a world in which content is available on-demand and in a device agnostic manner. The move to digital from analogue delivery methods has been a key trend among traditional television platforms, since digitisation offers less constraint on the number of channels available to viewers. The development of the internet has also seen the growth of online video platforms, which has given rise to changing behaviours of viewers around the world, as well as new competitors to traditional TV players. This report offers an overview of the advantages and disadvantages of the various TV and video platforms currently available.
Mobile video consumption is growing rapidly, driven by the growth in smartphone adoption and advanced 4G mobile data networks. However, direct monetisation of mobile video is challenging, with users opting for free services or video delivered as part of a wider premium pay TV or online video subscription, for which there is no additional fee for mobile access.
The digitisation of all content has unified delivery platforms, meaning that future technologies a more fluent interchange between different platforms. For example, a satellite TV image can interface with internet content delivered over mobile. This places pressure on video distribution to move towards higher quality video. The cost of this has two aspects: the availability of a network or spectrum to deliver, and the technologies needed to improve the efficiency of delivery over a given network.
For broadcasters, a drawback of the increasing prevalence of digital technologies and changing viewing behaviour is that the ease of obtaining unauthorised access to copyrighted content has increased. As a result of this, various types of piracy have arisen, which bring with them the risk of broadcasters losing control of their programming, as well as threatening the economics of intellectual property.
The impact of shifting audiences on global TV and advertising revenues will largely depend on the legacy structures of each country’s TV and wider media ecosystems. In order to illustrate the different characteristics of global markets, the final section of this report offers a closer look at the TV market in key territories worldwide.
The economics of the broadcasting sector
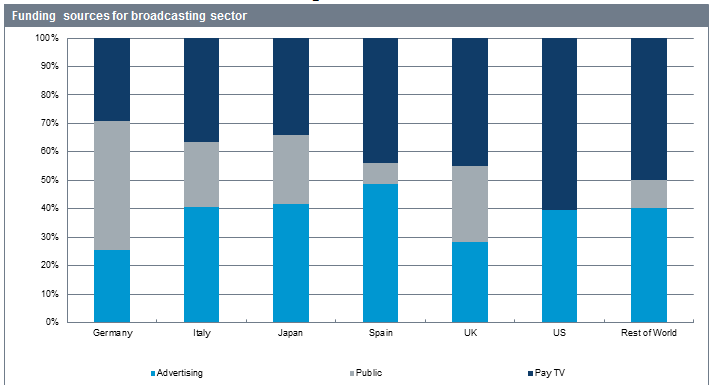
The worldwide broadcasting sector has developed into a mixed economy in which companies generate revenues from three major sources: advertising, subscription fees and public revenues.
Broadcasters funded by advertising and public revenues are typically free-to-air, aiming to transmit to the widest possible audience in their markets. The main vocation of advertising-funded or commercial broadcasters is to reach mass audiences or those of the most interest to advertisers (typically the most economically active). Publicly-funded broadcasters (variously funded by licence fees levied on households, government grants or other forms of direct taxation) place more of an emphasis on fulfilling public service goals of delivering information, education and entertainment to their national populations.
The longest established free-to-air broadcasters are mainly funded by advertising and are distributed via terrestrial networks. On the US model – one followed in other countries like Japan and Australia – broadcasters are essentially local operations serving a local metropolitan area. These broadcasters receive their evening or primetime programming from a centralised provider or network. Another model – followed in most European markets – is where broadcasters serve a national market, though still with some scope for providing some programming, like news, locally.
The last few decades have witnessed the consolidation of local stations in the US into groups and an increased in the proportion of stations that are owned and operated by major broadcast groups ABC, CBS, NBC and Fox. While publicly funded television exists in the US in the form of the PBS network, it is a much more marginal presence in the broadcasting market than is the case in Europe, where many public broadcasters have retained their status as market leaders (at least in the free-to-air market) since their early days as monopolies.
The advent of digital terrestrial transmission has greatly increased the number of TV channels available in the average home from four or five to 30 or more channels. However, this increase in the free to air offer has also fragmented TV viewing and these effects – combined with the worldwide economic recession of 2008/2009 – have posed a serious challenge to broadcasters. Some European countries are only starting to emerge from the downturn more than five years later.
Pay TV, in contrast, has continued to grow and flourish — although the pricing of pay TV services and their penetration in the market — varies considerably. In countries with high cable penetration, like Germany, the Benelux and the Nordics, packages of channels are available at low or minimal cost, but in markets where pay TV launched when the offer of channels was more sparse – like France, the UK and Italy – pay TV is a more expensive product offering exclusive content like first-run movies and exclusive sports. Broadcasts are encrypted and primarily funded by subscription fees either paid direct to the operator by subscribers (usually via satellite or IPTV) or via third parties (the usual model for cable TV). While some pay TV outlets (like HBO) are advertising-free, others are also partly funded by advertising. Canal Plus is France has always had an unencrypted evening window which included several commercial breaks.
Conversely, free-to-air broadcasters in the US have campaigned to receive a cut of subscription revenues from pay TV platforms. Carriage fees have become an important complementary source of income for the major US groups, although disputes over the level of carriage fees demanded by the broadcasters have resulted in frequent arguments between the two sides. European broadcasters in the Nordic region and Germany have successfully opened a similar revenue stream while ITV is lobbying to do so in the UK.
Free-to-air broadcasters are still major investors in programming in most markets, although the weight of their investment in sports means that pay TV operators have become the leading programmers in terms of in many countries: Sky TV in the UK and Canal Plus in France, for example. Even in the US, however, the broadcasters invest heavily in original programming, despite a dramatic rise in activity by basic and premium cable. In 2014/15, the five major US networks aired 85 original dramas and comedies, while cable aired 251 and SVoD players 19.
Overview of the pay TV sector
Whilst the broadcasting sector has seen the emergence of online video platforms in recent years, pay TV still accounts for the largest proportion of global TV revenue. Online revenues have indeed been growing since 2009, but currently IHS estimates around 5% of total global TV revenue (including public TV and broadcast advertising revenues) is attributable to online video.
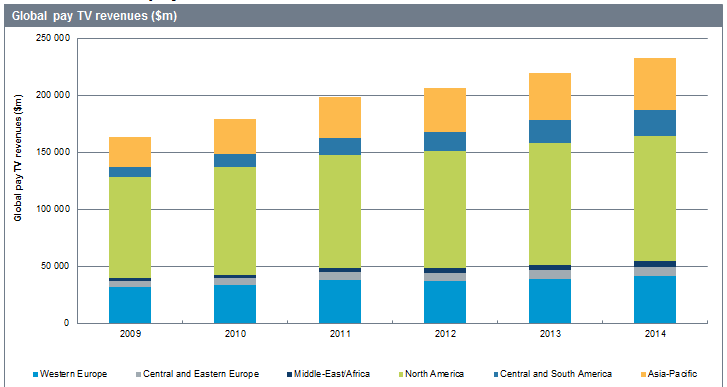
From 2009 to 2014 global pay TV revenues increased at a compound annual growth rate (CAGR) of 7.3%. This is despite the decline in pay TV penetration in some countries. IHS expects global pay TV subscription revenues to continue its positive growth trend over the next five years, however the rate of expansion is likely be slower in comparison to 2009 to 2014. Despite this, pay TV subscription revenues will continue to account for the largest proportion of total TV revenues.
Over the last five years, the fastest growing regions in pay TV revenue have been the Middle- East and Africa and Central and South America, which grew at a CAGR of 14% and 22% respectively from 2009 to 2014. In addition to this Asia Pacific continues to be a contributing factor towards global pay TV revenue growth, owing to expansion in markets such as China and India. IHS expects Asia Pacific, Middle East and Africa, and Central and South America to be the main drivers of revenue growth as pay TV markets in these regions continue to develop.
North America currently represents the largest portion of global pay TV revenues at 47%; however this is down from 54% in 2009. North American pay TV revenues have been increasing at 4% CAGR since 2009, yet this is the slowest rate globally. Western European revenues have been growing at a similarly steady rate since 2009, and currently account for 18% of the global total. Overall, IHS expects pay TV revenues in these more developed markets to continue slowing as pay TV become saturated. In mature markets such as the US for example, the increasing prevalence of newly-formed households not subscribing to any pay TV services (“cord-nevers”) are likely to have an impact on pay TV revenues, as providers such as Netflix challenge traditional pay TV packages.
TV Advertising
TV in the wider media advertising context
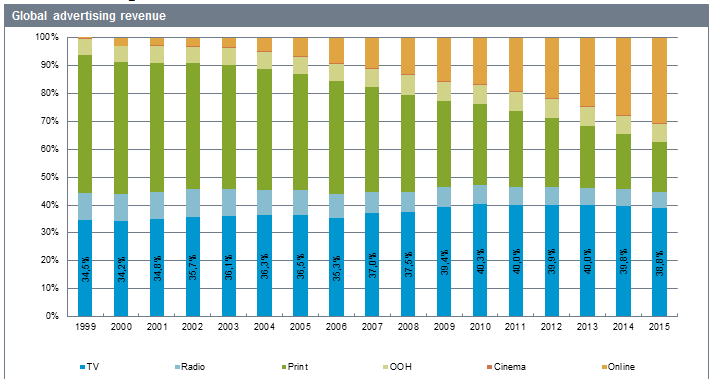
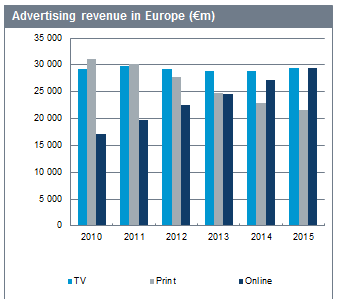
In the last five years, advertising markets have been characterized by the rise of online and mobile, deterioration of print and stability of TV. Between 2010-2015, newspapers and magazines have declined at a compound annual growth rate (an average decline per year) of -6.9% in Europe, -8.5% in the US, -4.3% in the APAC region and -5.8% globally. This is (in part) due to print budgets migrating online and has contributed to the strong growth in interactive advertising, which increased at a CAGR 2010-2015 of 17.4%, globally.
Throughout this time, TV advertising has remained stable, driven mainly by economic factors and quadrennial events (elections and sports competitions). Brand advertisers have remained loyal to the medium and perceive television as an effective tool in achieving their marketing goals.
In 2014, TV advertising revenue amounted to €155.2 billion and accounted for 39.8% of the total advertising market, globally. It is the largest advertising medium, more than 10 percentage points ahead of online, the second largest.
Television has maintained its share of advertising revenue between 39.0% and 40.0% in the last five years and this is unlikely to change to in the mid to long-term. IHS forecasts a slight decline in its share in the next five years; however TV advertising will still account for 38.4% by 2019, only 1.5 percentage points lower than in 2014. This demonstrates the resilience of the medium and its entrenchment in the advertising ecosystem.
In 2010-2015, TV advertising markets were mostly immune to cannibalization from new, emerging advertising formats. Traditionally, online has mostly attracted performance-based advertising, leaving the TV brand budgets largely untouched. However with the rise of online video, services like Netflix are beginning to dent broadcaster audience shares in some markets and TV ad dollars are beginning to transfer online.
Structural factors in television determine potential of online advertising
The magnitude of the impact of the rise of online video on TV advertising revenue will largely depend on the incumbent establishment of TV advertising structures. This varies by region. The opportunity for online advertising markets is proportionally larger in countries like China and the US, than in Latin American markets for example, and must be considered when analysing the impact of new advertising formats on traditional TV.
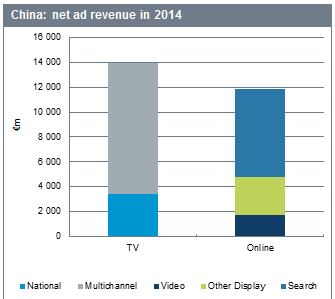
In China, there is stringent regulation on TV advertising covering both the length and content of the ads. Consequently many brands are already comfortable devoting a large share of their budgets to online advertising. As online video expands, the potential for cannibalization of TV ad budgets is hence higher as the transition from TV to online is not an unfamiliar one for advertisers.
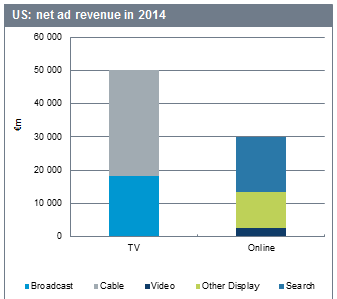
In the US, the TV advertising market is different than in most Western markets as 63.4% of total TV advertising revenue is generated by multichannel rather than national TV channels. Pay TV provides a more niche context for advertisers allowing for better targeting of audiences than free-to-air TV and acts more competitively towards online advertising, a highly targeted medium. Consequently, online video advertising’s share has remained quite small at 2.2% of total advertising revenue. However, the dependence of pay TV networks on niche audiences also means that they are much more flexible and willing to adapt to the shift of audiences online. IHS expects a increased innovation from US pay TV operators in the next two years, accelerating the shift of TV ad budgets to online video.
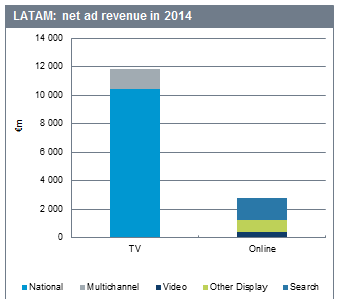
In Latin American markets, TV advertising is the dominant medium, with over 60.0% share of total media spend. TV ad revenue is generated primarily by free-to-air broadcasters like Globo, Televisa and Grupo Clarín. Advertising budgets are planned around TV with other media acting as complements to TV campaigns. This will not change in the next five or ten years and places a ceiling on how much spend online can divert from other media, as the pot available is smaller to begin with in Latin America than Western Europe. With relatively small print markets to penetrate, the shift to digital will be limited and largely led by the terms set by the Latin American media conglomerates rather than the newcomers like Facebook and Google.
The rise of online video: complementary in the mid-term, a threat in the long term to TV advertising
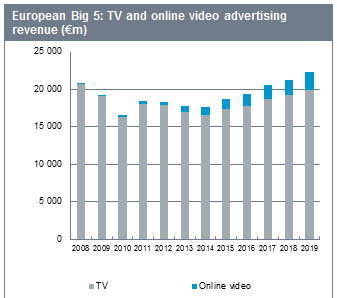
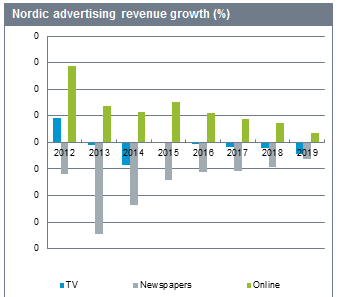
Online video advertising has so far been complementary rather competitive to TV advertising globally. For example, in the European Big 5 despite the increase in multi-screen consumption it generates incremental revenue to traditional TV ad budgets and is still relatively small. In 2019, video will account for 11.0% of all TV and video advertising.
However, there are other markets in Europe where cannibalization of TV ad budgets has already begun. In the European Nordics (Norway, Sweden, Denmark and Finland), from 2013 TV advertising revenue began to decline and it is forecast to continue falling through 2019. Although the cause for the drop cannot be isolated to one factor, Nordic TV broadcasters are increasingly citing the migration of audiences to online video platforms as a significant threat to their advertising revenues.
Online cannibalization of TV advertising revenue is still limited to few markets. However, it is important to note that global players (such as Google and Facebook and ad agencies such as WPP) are increasingly powerful players in advertising markets. These companies are creating new opportunities for advertisers and content producers to reach consumers and are increasingly targeting TV advertising revenue as their next source of growth. This will stimulate investment in online video content and increase innovation in advertising and technology among traditional TV broadcasters, who will fight to keep their audiences and hold on to their advertising clients.
Television and Video platforms
The distribution of television and video content is becoming increasingly complex as viewing preferences move towards a world in which content is available on demand and in a device agnostic manner. Traditional TV distribution platforms of terrestrial, satellite, and cable are moving towards complete digital broadcasting. There is a separate trend towards increasingly complex digital-only platforms.
Often, different methods of video distribution are referred to as linear and non-linear. In this report, “linear” content refers to content that is consumed at the time of broadcast, direct from the broadcast source. “Non-linear” content refers to material that is consumed on request, outside of the original broadcast period. References to non-linear content however exclude time-shifted content. “Time-shifted” is defined as content watched via a PVR (personal video recorder), or via an online or pay TV catch-up service within seven days of original broadcast.
Traditional Television Platforms
Terrestrial TV
Terrestrial TV services rely on a network of transmitter towers spaced around a given region. These broadcast the TV signal through either VHF (very high frequency) or UHF (ultra high frequency) transmission. Both VHF and UHF are portions of the electromagnetic spectrum typically reserved for short-range communication. Signals may propagate a little further than line of sight (particularly for VHF), but do not generally travel far enough to interfere with communications in distant areas, making them ideal for usage in TV and radio broadcasting. However, it can need more careful management around geographical borders where national broadcast may interfere with each other. Large geographical features, such as hills, mountains, or even large buildings can block terrestrial TV signals, meaning that a number of transmitter towers may be required to ensure that a given area has complete coverage.
UHF is increasingly preferred over VHF, as although the properties of UHF transmission mean that the tolerances in reception equipment must be tighter to enable clear reception, there are a greater range of suitable frequencies for transmitting TV. The range of usable frequencies has also effectively expanded as technology has improved and reception and broadcast equipment has become cheaper. In many markets, VHF TV transmission has been abandoned in favour of UHF. The UK dropped VHF terrestrial transmission in the 1980s.
The relatively short-range nature of terrestrial transmissions means that numerous transmitter sites are required. In a market such as the UK, this would be over 1,000 transmission towers to reach 99 per cent population coverage. In a market as large as China, in excess of 30,000 transmitter sites would be required for substantial population coverage using similar frequencies and technologies as North America and Europe.
Coverage may also vary at the channel level, depending on whether a channel belongs to a commercial or public service broadcaster. The public broadcaster channels are usually made available to the vast majority of a given country’s population, at the 95 per cent plus level and often are mandated to do so by the nation’s government. Commercial broadcasters, can pick and choose transmission locations, to maximise coverage for cost. Use of 100 transmitter sites might provide coverage of 80-90 per cent of the population for a country the size of France or the UK — sufficient for a leading commercial broadcaster, and at a fraction of the cost.
Digital terrestrial (DTT) services have replaced many of the older analogue terrestrial TV services in markets across the world, which reduces both wasted spectrum and transmission costs. Spectrum can be reallocated to revenue generating services such as mobile broadband. During the switchover from analogue terrestrial to digital, there is typically a lengthy dual illumination period, during which both analogue and digital signals are broadcast, providing the population with time to acquire necessary decoding equipment and switch their reception method.
There are a number of standards at use in the digital terrestrial world at present, including European standard DVB-T, Japanese standard ISDB-T, Chinese standard DTMB and North American standard ATSC. These standards have various different specifications for transmission mechanisms, but all aim to provide a template for multiplexing and improving the efficiency of frequency use. The European DVB-T standard is the most widely used worldwide, with deployments across Europe, Asia and South America. It has also been selected by African and Middle Eastern broadcasters. Different set-top box and transmission architectures are required for each different technology, meaning that, for instance DVB-T boxes are not compatible with ATSC transmission. Costs of reception equipment do vary as a result of the different scales of deployment. DVB-T boxes, for instance, are substantially cheaper than their ISDB-T counterparts.
In 2006 the International Telecommunications Union (ITU) put together a plan for the global migration from analogue to digital terrestrial television between 2015 and 2020.
The deadline for analogue switch-off in the Middle East, Africa and Europe is 2015. Most of this transition has already been completed in North America, most of Europe and some parts of Asia. The rest of the countries should complete this migration between 2015 and 2020.
Digitisation of the terrestrial platform has several benefits:
- Digitisation allows for increased spectrum efficiency which in turn allows for more channels to be broadcast
- Digitisation also allows for regulatory and government bodies to reclaim spectrum and repurpose it. Mobile’s appetite for spectrum has seen it become a beneficiary of this redistribution.
Following the 2015 switchover, there is a risk of signal interference between countries that have switched to digital broadcasting and countries which have not.
Cable TV
Cable TV services were essentially the first non-terrestrial TV transmission mechanism. While relying on much the same methods of transmission as terrestrial TV services, using frequencies in the UHF range, the signal is instead propagated along a copper or fibre cable. Cable TV services were first used to provide TV signals to communities cut off from a terrestrial TV transmitter due to geographical features blocking the signal. A single large antenna would be used to receive the signal from a point which was within transmission range, and the households in the TV dark area connected via physical cable. For the early cable services, as the signal was essentially identical to that broadcast over the airwaves, no specialised equipment beyond a standard television set was required by the consumer to receive and watch TV distributed via this mechanism.
The fact that cabling shields the TV signal from interference from external signals, and also prevents the transmission being carried from leaking and affecting terrestrial communication, led to cable TV becoming more than a simple retransmission mechanism. Spectrum reserved for other uses in the terrestrial domain could be re-used via cable, allowing multiple additional TV channels and radio stations to be carried. The larger number of channels available made cable TV ideal for use in broadcasting pay TV, where users would pay extra, to receive more channels.
Cable services have evolved since their first inception, moving to digital encoding of their signals, accompanied by roll-out of two-way data services. Two-way data systems, at their base level, allow broadband Internet and telephony to be delivered via cable, but are also critical for enabling new generation interactive TV services. In order for interactive services to work, there must be a one-to-one connection between the consumer’s set-top box or TV and the upstream parts of the cable network. This means that a consumer’s remote control button-press can be conveyed up the network and enable a specific piece of content to be delivered to that one consumer. In a one-to-many system, such as terrestrial broadcast, the TV provider has little to no directional ability, meaning it cannot easily send specific pieces of content to any single end customer. Increasingly operators with no two way data systems, such as DTH or DTT operators are using transmission over the open internet (OTT) to satisfy consumer desires.
The disadvantages of cable largely stem from the fact that households must be physically connected to the network in order to receive the signal. Cabling large numbers of households is extremely expensive and necessitates vast quantities of up-front capital expenditure. Costs of cabling on a per household basis vary depending on population density and geographical or planning issues, but a typical cost in developed markets such as the US or Western Europe would be €500-€1,000 per home connected or greater, and in the region of €200 for developing markets, such as China.
Furthermore, the economics of cabling low-density areas is such that in the majority of cases, a return on investment is unlikely, making cable TV only systems viable only for more heavily populated townships and cities.
Satellite TV
TV was first broadcast via satellite in the 1960s, however it was not until the 1980s and 1990s that the platform really began to take off as a means for domestic television reception.
Satellite TV services transmit signals largely in the C-band or Ku-band frequencies of the electromagnetic spectrum. These fall outside the VHF and UHF areas of spectrum used for terrestrial television and radio distribution, being at higher frequency. Such frequencies are typically ineffective for TV transmission from terrestrial transmitter masts or towers, as the signals are prone to interference from geographical features and buildings, causing them to attenuate rapidly. Delivering the signal in the frequency ranges using satellites, however, means that there will typically be no such obstacles in the way of reception, permitting C-band and Ku-band frequencies to be an effective method of signal dissemination.
Despite the lack of physical obstacles, however, the ~42,000km distance of the satellite from the Earth means that the signal is normally relatively weak by the time it reaches the point of reception and reception necessitates specialised equipment – namely a parabolic satellite dish, which collects the signal and reflects it onto a central reception antenna. The process amplifies the signal and eliminates noise or interference. Unlike cable and terrestrial TV, analogue and digital satellite broadcasts always require a specialised satellite set-top box to decode the signal. This is largely due to the fact that analogue satellite broadcasts are encoded at different frequencies to broadcasts via terrestrial or cable TV.
The higher frequencies which satellite broadcasts rely on come with benefits over cable TV and terrestrial TV in terms of data transfer. Higher frequencies have correspondingly higher bitrates, and can encode more information, normally allowing satellite to carry more channels than equivalent cable or terrestrial TV services. Satellite services also have the added advantage of not requiring any network build-out, meaning that compared to cable TV or terrestrial TV services, start-up costs are lower, but equally importantly, an entire market or region can be covered, including both low and high population density locales, making satellite TV a more economical proposition in more sparsely populated areas.
The disadvantage of satellite TV services compared to those using physical cabling, such as cable TV or IPTV, is that there is no one-to-one connection. This means that it is very difficult to enable true interactive services via satellite TV. Any signal sent out will be picked up by all users of the satellite service. Increasingly therefore, satellite services have been turning to alternative connection methods for enabling interactive services. These normally take the form of a secondary connection to the set-top box – usually in the form of a broadband connection. This allows the delivery of content on a one-to-one basis to users, as well as allowing them to communicate with the platform, enabling interactive services. The current issue with this approach is that the satellite provider typically relies on a) the user having a broadband connection and b) the broadband connection being of sufficient quality to allow relatively rapid content delivery. In this respect the ability of on demand services provided by satellite operators is synonymous to that of OTT providers.
IPTV
IPTV is a digital only platform. IPTV services work in a different way to those using radio frequency broadcasts; information is encapsulated within Internet Protocol, a communications standard used in computer network data delivery. This is then delivered via a broadband connection to the consumer premises. One of the key differences between IPTV and radio-frequency broadcast services is that a consumer receives a single channel at a time the data is usually transmitted using a standard compression method, such as MPEG-4. With IPTV, when the user switches channel, the signal is relayed up the network, the unwanted channel signal switched off and the desired channel then sent to the user. This essentially means that IPTV services are less constrained in the number of channels which they can offer compared to cable platforms, as the limiting factor, which is normally the bandwidth of the cable at the point of reception is no longer a major issue. IPTV services do suffer from other bandwidth related problems, however, covered below.
IPTV services should be considered distinct from online or web-TV services, herein referred to as over-the-top services (OTT), which are accessed via a PC or mobile device via the open Internet. IPTV services are delivered via a closed network, normally owned by the IPTV service operator, with the information conveyed inaccessible to those outside the network. This makes IPTV services analogous to digital cable TV operations. Only households connected up to the network can access the TV service. This is a contrast to online TV services, which are normally accessible through any internet-connected network. The advantage of the TV service only being available within a specific network is that the quality of the signal can be controlled, something not typically possible over third party infrastructure.
While in theory, IPTV services should suffer from the same issues as cable in terms of network deployment and the expense associated, the infrastructure required for delivering IPTV is often already in place, or in the process of being deployed anyway. In many cases, the largest IPTV providers are the incumbent telecoms companies, such as Singapore’s SingTel, Hong Kong’s PCCW, Germany’s Deutsche Telekom, meaning that they will typically cover the entire country with their telephony and broadband network. While IPTV availability will normally be lower than this due to some consumer connections being of insufficient quality to carry a TV signal.
One of the main problems which IPTV services face is that the infrastructure which they are operating over is not designed to carry TV signals. Traditional copper telephone lines cannot accommodate a great deal of data, meaning that in older networks, the bandwidths at the user end may limit what can be received. In general, standard ADSL lines are the minimum requirement for IPTV and will normally allow the delivery of a single standard definition TV channel if it is compressed using MPEG-4 to roughly 2Mbit/s.
The main advantage of IPTV over satellite and terrestrial in particular, is the two-way nature of the connection. As a consequence, all IPTV set-top boxes can communicate with the network. This makes the introduction of interactive functionality especially straightforward, with on-demand services available by default for most IPTV systems.
On-demand and online video platforms
On-demand Video
On-demand systems come in a variety of forms, with on-demand content available via mobile, computers and also via TV services. For pay TV platforms, there are several active forms of video-on-demand at present.
Near-VoD systems, or nVoD systems, are typically used by satellite operators, or cable providers which have yet to launch true VoD services. nVoD services rely on a single piece of content being broadcast on sequential channels with staggered start times. Customers can consequently begin watching the content at a time which suits them. nVoD is typically only appropriate for high value content, however, as it is bandwidth intensive and costly (for satellite operators) to run. Typically, therefore, content available on nVoD services is restricted to blockbuster movies, available on a PPV basis.
True VoD systems have replaced nVoD for many cable operators. True VoD (simply VoD hereafter) relies on servers being situated within a cable or IPTV network. When a customer to a VoD-enabled service wishes to access a content piece, the server streams the content directly to their decoder. Normally, VoD content can be rewound and fast-forwarded in the same way a DVD might be. VoD libraries typically complement a linear broadcast service, although historically, some providers have provided VoD as the sole means of accessing paid content, although this has rarely been a successful strategy.
Satellite providers, which typically lack the one-to-one connection normally needed for VoD have adopted a range of more sophisticated VoD-like technologies to attempt to keep up with cable and IPTV services. Push-VoD services use PVRs to store broadcast content and make it available in a VoD-like fashion, with instant access, rewind, pause and fast-forward. The downside with PVR-based services is that the numbers of videos available instantly will be substantially lower than those available on a VoD service, as capacity for storage is reduced.
With improved consumer broadband connections satellite operators have newer more sophisticated distribution methods using IP. Using hybrid STBs (DTH/IP) the operator can deliver content over the open internet (OTT) and deliver streamed content to the consumer. This allows a tVoD experience without having to invest in costly infrastructure roll outs that are associated with huge levels of capital investment. By delivering the content outside of the walled-garden of the pay TV ecosystem there is increased complexities in protecting the file from piracy although this is mitigated with the content still being tied to the STB.
With OTT distribution becoming increasingly important, although remaining niche in terms of total viewing time, the video-on-demand sector is moving away from relatively secure walled-garden of pay TV operators. The content is now being delivered via an open network where there are more possibilities for the video to be intercepted. Pay TV VoD is also often delivered via IP but for the likes of Comcast or BT this is done through the IPTV network and is not over the open internet. The rise of Netflix and other SVoD (subscription VoD) services have been the main drivers of OTT consumption over the last two years and have used Silverlight and HTML5 extensions to secure the premium content it delivers to consumers.
HbbTV
The HbbTV standard ultimately aims to enable consumers to enjoy a variety of entertainment services including video on demand (VoD), interactive advertising, personalisation, voting, games and social networking as well as programme-related services such as digital text and EPGs through a single access point. It also aims to avoid technology lock-in (where consumers are trapped within a small selection of devices as a consequence of limited cross-device content availability) and help to promote competition.
OTT & catch-up platforms: an overview of the major players
Netflix
Netflix launched its streaming service as a value-add to its core rent-by-mail business in 2007. The service was initially tied to both the physical rental business and to the PC in the United States. As the service was bundled there was initially no revenue being generated from online video. However, Netflix was moving ahead of the curve to transition consumers to online SVoD, a business model that is familiar to consumers through the pay TV industry.
Netflix actively managed the transition of consumers’ consumption to online video away from more familiar forms of consumption. Netflix incrementally improved the streaming service both in terms of device availability and content. Initially this was through dedicated Netflix streaming boxes, Roku was spun out of Netflix as a Netflix streaming box, and then to games consoles. The consoles were initially dependent on a Netflix disc being inside the device before becoming an application within the consoles media toolbar.
In 2011 Netflix moved to separate the Watch Instantly, streaming service, from its physical disc subscription. Although initially this was met with resistance from its subscribers it did not have a long term detrimental effect on Netflix’s total subscriber base. The company’s managed transition of its customer base to digital consumption has helped it convert its US service to 85% of its total Q1 2015 domestic revenues. The company has though faced significant challenges in controlling its costs in the lower margin business of OTT SVoD. Netflix has in response launched it Netflix Open Connect proprietary CDN. This allows the company to store its content on its own servers within partner ISPs network.
As Netflix has moved away from its physical disc business it has faced new challenges in protecting the content it licenses from content providers. Although with physical discs consumers could attempt to copy the content to their computer the studios would put DRM onto the DVD to try and stop this. When Netflix entered the streaming market it not only had to deal secure its own streams but also stop out-of-market users viewing content.
With rights licensed on a territory by territory basis Canadian Netflix subscribers are not licensed to view content sold for the United States. This also means that if a US subscriber travels to the UK they can only consume the UK’s Netflix catalogue and not the larger US catalogue. VPNing into different catalogues remains an issue for the company with Australia reported to have up to 200,000 users of the VPN technology.
BBC iPlayer
Launched on Christmas day 2007 the first version of the BBC iPlayer was distributed through a P2P network due to the bandwidth limitations that existed in the UK broadband market. As the iPlayer was updated it moved towards unicast distribution provided by CDN partners. The service developed away from a desktop client, which only allowed non-linear viewing, to a service that was based around variable bitrate streaming. The BBC must protect its content both when it streams the content but also when it is downloaded and consumed offline on the PC and mobile devices.
The BBC interpreted its public service mandate to bring the service to as many connected devices as possible. However, this led the service to have relatively high cost of development due to device fragmentation — with more than 300 different Android device versions being created. The BBC is perhaps unique in the number of devices it is available on and the number of versions that were in the market.
The iPlayer, however, remains a non-linear service. In March 2015 90% of video requests were consumed on an on-demand basis. However, radio consumption is mainly based around the linear schedule with 73% of consumption of the BBC radio stations being consumed as a simulcast. This is due to the peaks of radio iPlayer being the daytime whilst consumers are at their desk and cannot access a traditional radio.
The popularity of on demand consumption shows the importance of making content available from a legal source around the initial linear broadcast date. If this isn’t the case then consumers will take to illegal approaches to consume this content, either in advance of broadcast or post broadcast With a global market consumers are increasingly demanding popular international content to be made available as close to its original broadcast date as possible. The BBC took this approach with the first episode of the new series of Top Gear which was broadcast to a global audience simultaneously to avoid devaluing the show in international markets.
Amazon
Amazon currently offers video content in the United States, Germany, Austria, Japan and the UK with transactional movies and TV shows. In all five markets content is available to be rented (iVoD) or purchased (EST) and includes both TV and movie content. In both Europe and North America the e-retailer has uses its Amazon Prime subscription to bring TV and movie content to consumers. Prime subscribers have access to a selection of movies and TV shows at no additional cost. In Europe, due to legacy issues from the acquired Lovefilm business, subscribers can also subscribe direct to the video service. IHS believes that Amazon has been largely successful in managing its Lovefilm customer base to the Prime subscription over the standalone proposition.
MLB.tv
The digital media arm of Major League Baseball (MLB) provides mLB.tv. MLB Advanced media (MLBAM) currently controls all digital propositions of MLB and also is a white label provider of online video platforms, with HBO Now one of its more notable customers.
MLB.tv offers out of market baseball games within a subscription that last for the length of the baseball season (March-October). The subscription also gives consumers access to the MLB At Bat app, one of the top-grossing apps on the app store, where they can get news, highlights and radio feeds for games. Combined together MLB At Bar and MLB.tv had a reported 3.5 million subscribers in 2014.
The MLB season has 2,430 games and MLB.tv streams all out of market games to its subscribers as well as offering DVR functionality, alternative commentaries and multi-game viewing to a global audience. MLBAM streams content to games consoles, smart TV platforms, DMAs (Apple TV, Roku, Chromecast etc.), and has a native Windows 8 app. With traditional broadcast rights worth more than $1 billion a year the enforcement of blackouts on the service has ensured that traditional broadcast rights holders are not being undercut by the OTT delivery of games.
MLB.tv has been recognised as a leading technical platform for the provisions of high quality online sports video, winning an Emmy in 2014 for Technical Engineering. MLBAM has provided a high quality service that provides a huge amount of content that the fans could not get through a legal source via traditional broadcast methods. By embracing OTT delivery MLB has found accretive revenue to the league by being able to actively monetise every game rather than the limited number of games that were broadcast to fans in the past. In addition to incremental revenue it kept fans, in the most part, from needing to find illegal ways to consume these matches and thus avoided one potential driver of piracy.
Okko
Okko is a Russian online video platform with two business models; transactional, and SVoD. The service is available on a variety of platforms but its main revenue stream is from Smart TV Transactional VoD, with more than 80% of consumption on Smart TVs. Okko launched in July 2011 and provides access to more than 5,500 movies in HD, ultra HD (4k) and 3D. It also offers access to TV channels through its Okko TV service.
Despite high level of piracy in the Russian market Okko has been relatively successful by focusing on the Smart TV platform which allows them to protect content better when compared to other platforms. This has helped Okko in negotiations with content providers (mainly local studios) to show content earlier or at the same time as theatrical cinema releases. These changes to the traditional windowing of content have helped avoid piracy by making desirable content available more conveniently to consumers.
Mobile television and video platforms
Mobile TV
Mobile TV and video content can be delivered through a variety of different technologies. The growth in smartphones and tablets, 3G and 4G networks, and content distribution through application stores has fuelled demand for mobile video access. Mobile operator Vodafone reported that 40% of its European data traffic was from video and audio services in the third quarter 2014, up from 35% in the same period in 2013. UK broadcaster, the BBC, saw 47% of its iPlayer requests come from mobile and tablet devices in 2014, up from 38% in 2013.
There are three main ways of delivering mobile TV and Video content:
- Mobile Broadcast TV: delivering one-to-many linear content using broadcast rather than cellular spectrum.
- Mobile Unicast TV: delivering one-to-one linear content over mobile (3G and 4G) data networks.
- Mobile Video: on demand and recorded video that can be accessed over mobile data networks, Wi-Fi, or side-loaded onto mobile devices.
Mobile Broadcast TV
Broadcast mobile TV offers a number of advantages over mobile unicast cellular delivered content. Using a broadcast signal rather than a cellular data network reduces the data load for the mobile operator and allows subscribers to access content without data charges or using data plans. But the challenges mobile broadcast TV faced have exceeded the benefits. These challenges include:
- Limited handset support: Mobile handsets had to be customised with additional antennae to support mobile broadcast television.
- Additional infrastructure & spectrum requirements: Mobile operators required additional broadcast (non-cellular) spectrum for their own mobile broadcast TV services.
- Multiple standards & lack of global scale: The variety of regional standards included: CMMB, ATSC M/H, MediaFLO, DVB-H, ISBD-T. The lack of a single standard limited device support and the ability to offer services at scale.
- Monetisation: There was limited in interest in paying for premium services or an additional fee for already broadcast content.
- Content rights: Mobile operator run services need content rights or to work with premium content providers (e.g. sports channels).
- Quality: Most early mobile broadcast services suffered from poor picture quality. Often poorer than standard definitions (SD) and not capable of supporting high definition (HD), poor quality limited the user appeal of earlier mobile broadcast TV services
There was no global standard for mobile broadcast TV; instead regions adopted different broadcast technologies, which in turn required different mobile handset specifications which made mobile device makers less inclined to develop compatible handsets. This is also limited the addressable audience for each technology, making it harder to offer products at scale. Mobile devices required specific antenna support to receive the mobile broadcast television signal. Outside a few select markets, such as Japan and South Korea, there was very limited device support. The variety of standards includes:
- ATSC M/H (Advanced Television Systems Committee – Mobile/Handheld): The North American standard, still in limited operation by the Dyle TV consortium in the USA, ATSC M/H is an extension of the North American ATSC digital TV standard.
- CMMB (China Multimedia Broadcasting): The Chinese mobile television product backed by China Mobile was announced in 2006. Services began to roll out in 2009, by 2011 the service covered 800m people and there were 35m compatible handsets in use. However the rise of smartphones means that device support is limited and alternative video services are prevalent.
- ISDB-T (Integrated Services Digital Broadcasting – Terrestrial): The 1seg variant of Japanese digital TV is still relatively popular compared with other markets. At the time of 1seg’s launch, the Japanese handset market was dominated by local Japanese domestic manufacturers such as Sharp, Fujitsu, NEC and others which supported the 1seg standard. Japanese mobile operators’ strong role in handset distribution also helped create widespread device support for mobile TV. This means mobile operators can still require support for mobile TV in the handsets they sell even from international OEMs such Samsung. However, Apple is now the number one smartphone vendor in Japan and the iPhone does not support 1seg mobile broadcast.
- DVB-H (Digital Video Broadcasting – Handheld): The most widely deployed standard in Europe, DVB-H initially enjoyed strong backing from device makers, operators and the European Union in the mid-to-late 2000s, but its positive early momentum was short-lived. Formally adopted as a standard in 2004 and backed by the EU in 2008, by 2011 mobile DVB-H in Europe was in steep decline with most services closed or planned for closure. By 2013 DVB-H in Europe was largely finished.
DVB-H enjoyed later success in Africa with pay TV provider DStv launching services in 2010 via a dedicated mobile TV receiver (Drifta) and on supported handsets from Nokia and ZTE. The service launched in South Africa with a free tier provided by e.tv and subscription access from DStv. DVB-H services also launched in Nigeria in 2008. DStv continued to roll out its Drifta product across its footprint of African countries including launches in Kenya in 2011 Ghana and Uganda in 2013.
The Drifta mobile TV portable decoder receives a DVB-H signal which can be transferred to smartphones and tablets via Wi-Fi and USB. It is available to existing premium TV services who are not charged a premium for mobile access (beyond the cost for the device), a standalone mobile subscription is also available for a fee of ZAR 49 a month. In Africa, where 3G penetration and adoption of mobile data services is lower than in Western markets there is a greater opportunity for mobile broadcast technologies over unicast services. Services launched by a pay TV operator – which already has premium TV subscribers – also hold an advantage as a pay TV company is already making money from its TV subscribers.
- MediaFLO: Developed by Qualcomm, MediaFLO powered premium mobile TV services in the US which launched in 2007. Limited device support and limited user appetite for premium mobile television services hindered MediaFLO. The service was shut down in 2011 after US operator AT&T acquired the service from Qualcomm for its spectrum holdings.
- T-DMB (Terrestrial – Digital Multimedia Broadcasting): The digital TV standard developed and mainly used in South Korea (with some international deployments), T-DMB has been widely used on mobile handsets in South Korea. Similar to Japan’s 1seg, the Korean service benefited from the support of domestic handset manufacturers including LG and Samsung and strong mobile operator backing. More recent devices have shifted away from offering T-DMB via a built in antenna (though it is possible to use the headphones to receive a T-DMB signal). Mobile TV services remain popular in South Korea which has been the first to launch a commerce LTE Broadcast service (see below).
Encouraging users to pay for premium mobile TV content has been a challenge for most broadcast mobile TV services. More successful services often broadcast the existing free-to-air television and so there was no additional monetisation.
Early variants of mobile broadcast television required significant hardware support including the addition of an antenna on the mobile handset to enable it to receive the broadcast signal. The limited appeal for premium services, and the variety of different standards, meant that device makers – outside a few key markets – were reluctant to invest in customised hardware.
Mobile Unicast TV
Using the existing mobile data networks means that services would enjoy widespread device support without the need for customised hardware. Unicast services also meant operators did not have to invest in additional spectrum for broadcast content transmission. Unicast services do come at a higher cost to the operator as the data is delivered to each user individually rather broadcast to many. Mobile unicast services saw more widespread success than most of the mobile broadcast services discussed above. However these too faced the fundamental challenge of monetisation, with users proving increasingly unwilling to pay a premium for mobile access to content – beyond a few notable examples such as premium sports content. The challenge of balancing data and content costs has been another issue for mobile unicast services with some operators alienating users by charging users a subscription fee for the content and also charging for the data used to access the content.
Mobile Video
The growth of smartphone penetration and content distribution via application stores has driven the appeal of cross platform mobile video services and therefore undermined the appeal of mobile only, particularly premium mobile, video services. Alongside unicast mobile television services, many mobile operators also developed on-demand offerings, but premium mobile only or mobile specific services were not able to compete with international OTT video players.
Direct revenues may be limited, but mobile video consumption is growing rapidly, mainly delivered over mobile or Wi-Fi networks via smartphone and tablet applications distributed through mobile app stores. The leading providers of mobile video apps include:
- Free advertising funded services such as YouTube or Dailymotion
- Free-to-air television providers that offer linear and catch-up content at no extra charge
- Pay TV companies that provide cross-device access as part of the standard content bundle for example Sky Go in Europe, and GO by OSN in the Middle East. OTT subscription video services that charge a single subscription free regardless of platform or device e.g. Netflix, Amazon Prime Video, and Voyo.
The prevalence of the above models of mobile video distribution and monetisation makes it increasingly difficult to generate direct revenues from standalone or mobile specific TV and video services.
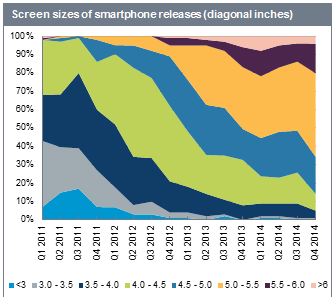
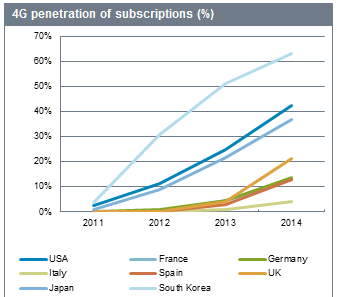
The evolution of mobile devices and networks has increased and addressed the demand for mobile video smartphones. Large screen smartphones provide a much better viewing experience the previous devices; more than 80% of smartphones released in Q4 2014 featured screens larger than 4.5 inches across. Screen quality is also improving with around 50% of Q4 2014 smartphones boasting high definition or better screens. The growth of 4G mobile which offers much faster data and lower latency data connections than 3G has also boosted mobile video consumption. By 2014 4G accounted for 42% of subscriptions in North America, 7% in APAC (and 36% in Japan, 62% in South Korea) and 3% in Africa and the Middle East.
LTE Broadcast
LTE Broadcast, also known as multicast or eMBMS (evolved Multimedia Broadcast Multicast Service), is a technology that allows the simultaneous downlink of an identical data packet to multiple devices at consistent speeds. Unlike many older mobile broadcast technologies it is a part of the 4G LTE standard, included in release 9 of 3GPP, which should boost its likelihood to succeed in the market because of wider industry support.
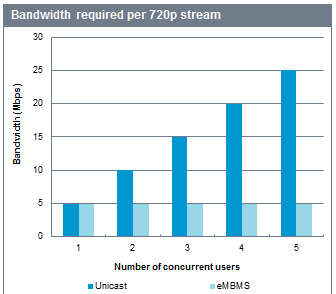
Its key differentiator from traditional 4G LTE mobile data downlink, or unicast, which is used on mobile networks today, is that it is not affected by the number of users connected. Traditional mobile networks require greater capacity in order to handle increasing number of users accessing the same video stream or data download, whereas LTE Broadcast utilises its dedicated spectrum to deliver the same information to multiple users without an additional burden to the network.
Operators are able to trade-off how much capacity is used by LTE Broadcast, and how much of a mobile network’s capacity is available for regular LTE services, in order to support higher quality video delivery or more simultaneous video streams. Typically, LTE Broadcast will deliver between three and five linear TV streams each with 720p HD video quality.
LTE Broadcast requires relatively little infrastructure compared to an LTE network deployment. The additional infrastructure required to enable LTE Broadcast is a software upgrade. This makes a network upgrade orders of magnitude cheaper than deploying a new mobile broadcast network, on new frequencies, and hence relatively fast.
The trend towards technology neutral spectrum licences in Europe should make deploying LTE Broadcast straightforward. For countries where the telecommunications regulator is separate entity from the TV regulator, the licensing process will likely be more unclear.

Consumer viewing habits
Viewing time
Cross-platform viewing times provide an insight into the changing behaviours of viewers around the world. IHS tracks the total viewing of France, Spain, Germany, Italy, the United Kingdom and the United States. By combining viewing time data from linear television, PVR (personal video recorder) time-shifting, pay TV video-on-demand services and over-the-top (OTT) content IHS is able to provide a holistic view of how video consumption habits are changing in response to the emergence of new media in these key markets.
In 2014 television content, linear and time-shifted viewing equated to 96% of all video consumption in IHS’ six sample markets, with a combined viewing time per person per country of 1,574 minutes of video per person consumed each day through the TV. Despite a decline in linear TV consumption, it remains prominent in each of the monitored markets, equating to an average of 88% of total viewing time and reaching as high as 94% of viewing in some markets.
PVR viewing is the most popular non-linear method of viewing TV content, representing more than 50% of all non-linear consumption in 2014. Although in 2014 time-shifting slipped 1.6% in terms of overall viewing time it remained at an average of 6% of the total. Unlike linear which remained consistent across the markets, time-shifting levels varied due to differing levels of PVR and VoD availability. For example, in the United Kingdom where PVR systems are provided either as standard or at a nominal charge by all pay TV operators time-shifting makes up 17.1% of all video consumption. In Spain however, PVR penetration is comparatively low at just 14%, with PVR viewing making up just 3% of total viewing.
Weather conditions, economic shifts and popular sporting events all have an effect on viewing time. In 2014, for example, declines in UK linear viewing were partially offset by an increase during the 2014 football World Cup. In the US, linear viewing time is inflated by the Super Bowl. Across the six markets there is a general trend towards a reduction in linear viewing, however it is worth noting that these reductions are nominal, between 1% and 2% annually.
Move to on-demand
Pay TV VoD services offer a range of experiences depending on the availability of set-top box (STB) connectivity. Historically linear based pay-per-view (PPV) and near video-on-demand (nVoD) solutions were employed by operators on receiver only STBs. With the rise of two-way networks and true VoD, operators have moved to enhance their offerings with internet connected STBs and a rise in IP-VoD (Internet Protocol video-on-demand) delivered over the open internet has been observed. Typically the number of views of on-demand content has increased in line with this transition as customers take advantage of the flexibility of true VoD content. In 2013 and 2014 pay TV VoD viewing grew 1% year-on-year. However, pay TV VoD only represents 13% of non-linear viewing and 1.7% of total viewing in 2014.
In 2014 OTT viewing time increased by 4.2% across the six markets with online short form content continuing to lead the field with a 2.6% share of total viewing time across the countries. Short form content grew on average by 1% in 2014 with the US and France leading with 6 and 7 minutes of total viewing time per person per day respectively. Extending beyond user-generated content (UGC), short form video is increasingly seen as the ideal format to reach the growing smartphone segment in both developing and developed markets. Major television networks such as the BBC are also exploring the possibilities of short form video, creating companion shows to drive engagement with its core shows’ audience. Short form content is particular popular with younger audiences, figures from YouTube’s Multichannel Networks (MCN) indicating the most active demographic being aged 14-24 years old.
Online long form content viewing has accelerated in growth over the past 3 years. In the US, the success of subscription video-on-demand services such as Netflix has led to fears of a long term decline in traditional pay TV subscriptions, (known as ‘cord-cutting’). In all the markets monitored, except Italy, there has been a decline in linear TV viewing, however this decline has been minimal. Qualitative consumer surveys and quantitative measures consistently produce varied results in regards to consumption of online long form video, which can largely be attributed to the passive nature of television consumption. Television audiences continue to follow established viewing patterns in regards to channels and programming in contrast to the more pro-active content discovery behaviour common in online platforms. Online long form content in 2014 on average constituted 2% of viewing time (or 13% of non-linear viewing) In the US, where this behaviour is at its peak, viewing share only reached 3% of average daily viewing.
TV Everywhere: a reaction to changing viewing habits
TV Everywhere (TVE) services are one approach that pay TV operators and network owners are exploring to combat a growing trend of cord-cutting. In particular, they are attempting to add new functionality and interactivity to the television viewing experience and allow consumers greater choice on how they consume their content. TVE has been developed as a collective strategy to enhance the traditional linear TV proposition by allowing viewing off the primary screen, onto second screens like tablets, smartphones and other devices. Pioneered by Epix, HBO, Time Warner, and Comcast, TVE services have taken on myriad forms, with each company adopting a slightly different strategy for success.
In spite of the differences in strategy, all TVE products have one thing in common; they allow current pay TV video subscribers to consume content on alternative devices to the pay TV STB either on a live or on demand basis.
All major pay TV operators have implemented some form of TV Everywhere service, although sometimes in very limited forms. Most operators provide web portals and/or apps for their customers to consume content away from the main TV screen. Despite mobile devices driving consumption of content within a TVE service, the majority of it happens on the customer’s home Wi-Fi.
In many cases, the significant out-of-home TV Everywhere product is video-on-demand (VoD)with on demand content being more accessible than live. Operators will consolidate their licensed and original VoD content on web portals and apps. Even though the streaming of live channel feeds is largely relegated to the in-home space, NBC Universal, News Corp. and Disney have made several channels available for out-of-home streaming in the US, both on Wi-Fi and on cellular broadband.
VoD streaming
VoD streaming has been the most ubiquitous form of TVE, right from the very start in 2009 when Time Warner and Comcast first introduced the idea. However, the momentum appears to have shifted to streaming of live channels as pay TV operators bring full (or nearly full) line-ups to second screen devices. The long-term obstacles hindering the widespread rollout of live TV Everywhere content are licensing agreements. In the US Discovery Communications remains the lone major channel group hold-out not offering any TVE services on network sites or apps; VoD or Live Linear.The international business of discovery has made its content available to pay TV operators within their TVE service.
IHS believes that there will always be a place for live linear content because it offers customers the ability to consume content as it happens, which is extremely import for event driven programming. The availability of live linear streaming outside of the home is growing, but as yet, is still nascent when compared to traditional broadcast consumption.
Digitisation of content and piracy
As digital technologies and the internet continue to transform television, the ease of obtaining unauthorised access to copyrighted content increases. The following section of this report offers a closer look at how piracy has arisen and the different types that exist.
Main causes of piracy
The supply side of piracy falls into approximately two categories: persons or organisations aiming to profit, or groups believing that content should be free. The demand side of piracy can be multi-faceted, consisting of groups either unwilling, or in some cases, unable to pay for content.
Access Fees
The cost of pay TV subscriptions and costs of hardware setup are some of the biggest barriers to accessing broadcast signals. Although access fees cannot be cited as the sole reason for unauthorized access to broadcast signals, markets where top level access fees (as a proportion of monthly, per capita GDP) are high, tend to witness higher levels of piracy. Countries with an highly unequal income distribution, which despite having proportionally lower top level access fees, also display a higher than average level of piracy. Healthy competition between providers, help to keep costs low and make content available at multiple price points also serves to reduce the propensity to pirate content.
Deliberate restriction
Often content is deliberately restricted from being shown in certain regions (geo-blocking), certain times (windowing), or certain platforms. The rationale behind content restriction is maximising revenues by selling or renting content multiple times and at multiple price points throughout its lifecycle. For example sports are often “blacked out” in regions where they’re shown live to encourage fans to stadiums. Movies are released first at cinemas, then made available for rental and viewing on premium TV channels, followed by release on broadcast TV and SVoD services. This can be frustrating for consumers who are aware that content has been released, but is not available via the method they wish to consume it, or at a price point they are willing to pay.
Regulations
National regulations, such as those in France, can often serve to re-inforce the traditional windowing system. While aimed at encouraging the flow of content across media platforms, the restrictions can often encourage piracy of in-demand content.
Types of content piracy
Increases in broadband penetration and speeds have also come hand in hand with making the transfer of content by illegal means easier and more convenient. The International Federation of the Phonographic Industry (IFPI) estimate that that 20 per cent of all internet users regularly access unlicensed services on desktop devices alone.
Methods of piracy can consist of either file sharing where entire files are transferred to the user’s device, or streaming; where a video or audio feed is streamed in real time to the user. In both cases the data can be transferred as a single stream of data from host to client, or can be transferred in a peer-to-peer (P2P) network, where all devices that are downloading or have downloaded content, also transfer data to the other devices in the network.
Legislation to counter piracy has had a direct impact, as well as allowing for the ‘management’ of illegal activity. With many thousands of illegal streams being removed, ISPs blocking access to illegitimate content providing sites and also with legitimate websites becoming increasingly co-operative or prideful of protecting content IP there has been a sizeable success in the promotion of legitimate, monetized content. Although sites have been closed and even some major players in online piracy have been incarcerated, it still remains possible to bypass restrictions and currently is nearly impossible to stop someone who is committed from acquiring unlicensed content from doing so. This means that although many steps can be taken to minimise damage from piracy, strategies should be currently formulated to manage piracy, rather than to eradicate it. The following is an outline of the major methods that are used for pirating content and also include a number of techniques which allow restrictions put in place by ISPs and media players to be bypassed.
Torrenting
Torrenting, or BitTorrenting, is the term given to the use of a peer to peer network (P2P), to transfer data and content using the BitTorrent protocol. It is not to be confused with P2P streaming, as the end result is a duplicate copy of the desired file on the user’s device, rather than a video stream that is not stored anywhere. The process required the user to first download a program or ‘client’ that will facilitate the transfer of data from the P2P network. There are a number of clients available, which range from small or ‘lightweight’ clients such as uTorrent which provide functionality for P2P transfer only, to larger clients such as Vuse, which also incorporate browser capabilities enabling users to discover content within the program itself. Both programs offer advertising funded versions, as well as a premium version, with the advertising removed. Although the majority of use for these clients is the transfer of content in breach of IP, they do not actually host either the content, or even the files (trackers) which allow users to start transferring content.
To initiate transfer a user must locate and download a small file called a tracker or tracker file. This small ~50kb file contains metadata on the file to be transferred which is then used in conjunction with a server (BitTorrent tracker) to keep track of where file parts are located and the availability of peer machines to transfer data. Trackers can be divided into two distinct groups; public trackers which can be accessed via the open internet and private trackers which require users to register before they can be used.
To locate these files, a number of websites have been set up to keep track of content by indexing files with metadata and supplying trackers or ‘magnet links’ which serve the same purpose. While the indexing sites do technically not host content, founders of sites such as ThePirateBay have been found guilty of copyright infringement and ISPs have been ordered to block the sites. Although the sites do also index some legitimate content, such as IP free video content, software, and game updates, the most popular usage is not for these legitimate purposes. It is important to note however, that P2P technology is not exclusively used for illicit file transfer and plays an important role in a wide range of businesses and programs including ranging from Skype, Word of Warcraft, Adobe’s Flash player 10.1 and Spotify. Actively targeting and blocking the BitTorrent protocol from internet traffic, would therefore have a significant impact on legitimate business.
Blocking by ISPs
Increasingly, ISPs are blocking users from sites that are involved with breach of IP, with the main sites for a number of popular torrent sites blocked completely from access. IP owners are able to petition courts to review evidence surrounding a site, with the aim being to prove that the primary purpose of the site is to facilitate the illegal dissemination of content. The court order not only enables the ‘takedown’ of a website, but also crucially protects the ISP and interested parties from backlash from the website related to loss of earnings or net neutrality.
VPNs
There ae two main methods to circumvent restrictions placed on websites by ISPs. Firstly, the targeted website can create a new domain which ‘proxies’ the original and allows the main site to be accessed via a different URL to the one which is blocked. Secondly, the user may make use of a VPN, or virtual private network, to hide their activity from an ISP, preventing the ISP from blocking access to a site. The widespread use of VPNs for this purpose is relatively new; previously VPNs have mainly been used by businesses and governments to transfer sensitive information and also by individuals from inside countries controlled by oppressive regimes. Many businesses will use a VPN to allow employees to securely access work files from a remote location. Attempting to disrupt the use of VPNs will have negative impact on a wide range of legitimate uses.
A secure VPN such as those used by businesses require the installation of a program which will encrypt data being transferred across the open internet and then decrypted at the other end by the target. More recently, very light VPNs have crept into existence, which may be as simple as a website accessible by a browser or an installed app which mask or funnel a user’s traffic through itself, effectively hiding a user’s activities. These can effectively circumvent an ISP blocking a domain, or even get round an internal networks list of blocked sites. Since they are based in either a browser or a mobile app, the light clients are inherently user friendly and can provide functionality with the click of a button. Examples include Hola VPN (which claims 44m global users) and Hotspotshield. VPNs such as these do not grant the user a good level of anonymity, and although bypass blocking and geolocking, it would be possible in many cases to match a user’s IP address contacting the VPN host, with content being accessed.
VPNs can also be used in conjunction with streaming sites such as Netflix which are geo-locked, often in accordance with digital rights distribution deals. VPNs can mask a user’s origin and make it appear that the user is in a different country. An example of this would be a Netflix UK user using the Hola VPN service to misinform Netflix servers that they are in the US, and consequently accessing US content. Netflix has moved slowly to combat this kind of piracy which despite being in breach of EULAs, do still require a user to subscribe. HBO which has recently been very heavily affected by piracy, has taken a more aggressive approach and is actively finding VPN users of the HBO NOW service and sending them warning letters.
More developed VPN services are subscription based, and offer a more advanced functionality with greater protection for users. This means that not only can users bypass many restrictions, but can also be guaranteed a high degree of anonymity. A number of VPN providers log traffic, IP addresses or otherwise stamp user information in such a way as to allow the user of the VPN to be matched to activity, although the VPN still functions to ‘tunnel’ through to the desired site and prevent the ISP from blocking access. Therefore, user activity data does exist and depending on where the company hosting the VPN is located could be compelled by court order to release information indicating user activity. TorrentFreak.com carries out surveys of popular VPN sites and release information to users to inform decisions about which are the most private services.
Streaming
While P2P download piracy is a serious problem for episodic content, in the case of live event-driven content, the transfer of files after the event has finished is much less damaging. Sports content or popular reality shows suffer far more from the transmission of illegal streams, many of which can be found simultaneously with broadcast.
With the advent of formalised internet protocols, greater bandwidth availability and more widespread uptake of connected devices streaming of music and video has greatly expanded in use. According to Nielson; in 2013 there were 118.1 billion music streams, while video streaming currently represents around 30% of all internet traffic.
User generated streaming services are hugely popular with sites such as YouTube gaining problems with illicit content as they grow in popularity. Live streaming services allow the sharing of a user’s uploaded video, as it is transmitted to the sharing site. Sites such as Twitch are increasingly popular among the gaming community, who consume live feeds from other gamers and gaming events. While YouTube and Facebook have met some success in tackling content in breach of copyright; the combatting of live streaming is technically more difficult and many legitimate live streaming sites are either not equipped to deal with this problem.
P2P Streaming
Not all streaming is transmitted from a single location via unicast. Some programs, such as Popcorn Time, allow users to stream content P2P, rather than streaming content from a single server the files are shared throughout all users of the service. When a TV show or movie is selected for streaming, the program identifies users with the requested file segments and initiates the transfer of them, facilitating streaming. The use of P2P streaming is not a recent innovation with iPlayer using this technology up until 2008, until the BBC trust abandoned it in favour of more traditional means.
The advantages of P2P transfer are that loads on servers are extremely light, as no content data is actually transferred from website host to user. It also offers advantages around reliability as, although a tracking site is still needed, once a transfer is initiated, it will continue for some time even if the host site is no longer available.
Direct File Sharing
One of the more challenging methods to manage is the use of file sharing sites. File sharing or file storage sites allow users to store content online, either behind a password protected front end, such as Google Drive, or in a more open format where anyone with a link to the file can access it. Legitimate purposes can be storing documents photos or even music that a user wishes to make personal use of, using whatever device they may have to hand. Users can also store illegitimate content, as easily as they would on their own hard drives.
While Google will respond to copyright complaints by issuing warnings and terminating accounts, it can be difficult to detect illegitimate content, or even legitimate content, that if being shared in breach of usage rights. Dropbox has a novel solution in the form of hashing all content that is uploaded. This process involves running an algorithm on the raw data of any file that is uploaded and generating a hash string out of it. For example an MD5 checksum on a version of the WIPO logo would equal “F0DC08FE2D78890929E7E59B5902936B” for example. This hash would be the same wherever the image was used and would allow illegitimate use of such an image to be easily identified. Theoretically, by fingerprinting legitimate content in the same way, Dropbox can tell if content is copyright protected. Then if content sharing is also monitored, illegal sharing can be immediately terminated. However, if the file is modified in some way, encrypted or compressed then this method would leave copyrighted files undetected. In fact tools such as Boxcryptor exist, which allow users to easily manage the upload and download of encrypted files, while for ad-hoc files, users can apply something as simple as WinZip to foil detection.
Hardware enabled-piracy
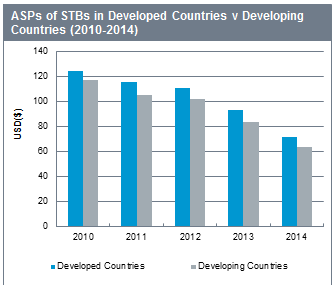
The decrease in the average price of set-top boxes across platforms over the years has been the result of price competition and saturation in the pay TV market. While, price erosion has undoubtedly meant pirates can procure an access point to pirating content at a lower price, it does not remain the sole factor contributing to piracy.
There is no definitive correlation between the rate of piracy based on the price of STBs in developed or developing countries, however, the STB market does have a large proportion of cheap STBs, made in developing markets such as China and India, where component and manufacturing costs are low. While these boxes were mainly used in developing markets, they are now also being sold across the globe in developed markets, a possible result of the increasing price of pay TV. These cheap boxes are sufficient enough in terms of hardware to be repurposed for pirating content by pirates. The majority of these STBs are built on open source standards to maximise device compatibility and because they are cheaper to implement than proprietary standards. This makes them not necessarily more vulnerable to hacking but the lack of control makes them more subject to manipulation when compared with expensive STBs and their sophisticated content security systems.
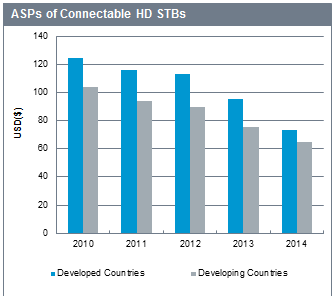
Most significantly is that some cheap boxes are now also connectable, in order to leverage the open-source standards and access to apps. Connectable boxes could be considered the more substantial factor on piracy, prices of connectable boxes in developing markets is considerately less compared to developed, and now 53% of STBs* shipped globally in 2014 are now connectable.
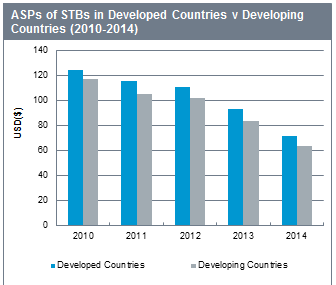
Satellite STBs have historically been cheaper compared to other platforms because of its transmission method. Although the low price of a satellite box can be an incentive for pirates, it is mostly the one way nature of satellite transmission, which has made it attractive to pirates. Unlike other platforms, satellite has no physical infrastructure to enter like cable or IPTV. The “break once run everything” scenario of satellite and the ability to access a wide variety of premium content has resulted in satellite being more likely to be hacked.
Control Word Sharing
Control word sharing is a way of allowing multiple clients to access encrypted content with one set of decryption keys, also known as control words (CW). In a typical use case a legitimate receiver is equipped with software which allows it to share the control word over the internet to pirate set top boxes (STB), this allows them to access the content as if they had their own subscription. In addition, control word sharing also allows for the retransmission of content itself.
Part of the popularity of control word sharing is that the control word for DVB-based services is only 64-bits long and shared across all legitimate subscribers of a service. The short length of the key makes sharing this across public and private groups a trivial affair. STB manufacturers offering internet-connected STBs with software that manages the internet-delivered control words have boosted control word sharing. Control word sharing occurs in both commercial and non-commercial areas.
Control word sharing is largely a problem for satellite operators for a number of reasons. The large geographic reach of satellite transmissions makes signals available to people with no legal means of paying for decryption. Satellite broadcasts also contain large numbers of channels increasing the pay-off from decrypting the signals. The one-way nature of the transmission makes it difficult for broadcasters to monitor control word sharing.
Broadcasters can frustrate users of these systems by increasing the frequency of control word changes, up to every few seconds. The extra stress this places upon the control word sharing system can disrupt it causing frequent missed viewing periods.
Smart Card cloning
Cloned smart cards are copies of a legitimate smart card, which are then distributed to enable users of the pirated smart card to gain unauthorized access to broadcast signals. Pirated smart cards contain all the encryption coding present on the original card, and makes the STB believe that it is reading a legitimate card.
Broadcasters operate a 4-5 year replacement cycle for smart cards used for conditional access, in part to limit the impact of cloned cards and the inherent shortage in permutations of encryption keys.
Mobile Video piracy
The growth in smartphone application stores can also enable access to new forms of content piracy. This is particularly the case on Android devices as unlike Apple’s more tightly controlled content and device ecosystem, Android is more open. Android device users can choose to download content from any source and so efforts to prevent content piracy are limited. Google and other application store owners can try to limit any illegitimate content from being distributed via their stores, but they still distribute mobile applications that provide tools such as torrents to download, stream, and view pirated video content. The advances in mobile technology in terms of network bandwidth, content distribution, and device size and quality are driving demand for video content and making access to pirated content easier.
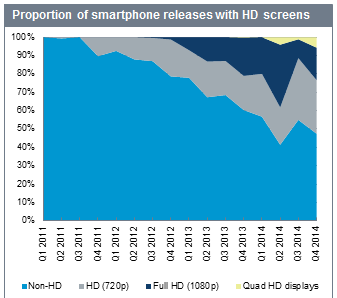
Mobile devices and applications can also enable different forms for piracy including:
- Screen recording and sharing: Some smartphones from leading manufacturers provide built in screen recording functionality which can be used to capture and then share copyrighted material.
- Live broadcasting apps: These include recently launched apps from Periscope and Meerkat as well as some built in live streaming apps which enable users to broadcast video content directly from their mobile devices over mobile and Wi-Fi networks. This could be used to stream copyrighted live broadcast content from other devices.
Limits on data plans and mobile network quality, however mean that most piracy is likely to take place on Wi-Fi rather than cellular networks. In this context, beyond using mobile apps as a way to access sites that provide pirated content, the nature of most mobile video piracy is similar to online video discussed above.
Physical Piracy
Physical piracy involves the unauthorised copying of physical media, usually for commercial reasons. The introduction of optical disks and the low prices for recordable media make the process cheap. Physical piracy is typically more prevalent now in markets where broadband infrastructure is less well developed.
Successful combating of piracy: case studies
As broadcasters have looked towards monetising their TV everywhere platforms they are placing greater emphasis on combating piracy. The largest satellite operators are enlisting the support of conditional access vendors to use automated anti-piracy solutions.
Large sporting events are magnets for pirate activity due to the high interest and that the broadcast rights are often sold to paid channels.
OSN – ICC Cricket World Cup
OSN, the largest pay TV provider in the Middle East and North Africa worked with Viaccess-Orca to prevent unauthorised streaming of the 2015 ICC Cricket World Cup. Viaccess-Orca activity monitored live video re-streaming, determining where piracy is taking place, the amount of piracy occurring, and who is watching the re-broadcasts. OSN was then able to send cease and desist orders to pirates, alongside deploying real-time technical measures to disrupt streaming. Additionally, Viaccess-Orca gathered evidence to present to law enforcement and government agencies. Viaccess-Orca estimated that throughout the tournament it eliminated 60% of the streaming link and interrupted the illegal viewing for 50% of the audience.
Irdeto – FIFA World Cup
The 2014 FIFA World Cup was subject to strong pirate activity. Irdeteo disrupted 3,700 throughout the tournament. European broadcasters were the main targets, accounting for 27% of streams it detected, followed by North American streams. Irdeto’s work highlights the multi-national aspect of piracy: the most pirated match was the semi-final between Argentina and the Netherlands, but a North America channel was the most featured channel in the unauthorised streams.
Future of broadcasting technology
There are several technologies that may have a significant impact in the future capabilities of broadcast. As for every transmission system there is a balance between the amount of information being transmitted and the technology used do so efficiently.
Video distribution is under pressure – regardless of consumer demand and how that video is delivered – by the drive towards higher quality video. The technical notion of higher video quality is easy to qualify: higher resolution, more frames and better colours are the key variables. However, quantifying to what degree these technologies are appreciated and therefore demanded by the average consumer is harder. Many tests suggest that resolution increases beyond 4K will simply not have in-home applications, while frame rates and greater colour space and detail has more obvious benefits but doesn’t have the track record when it comes to selling to consumers. High Dynamic Range (HDR) is the current industry focus – a colour based technology – along with 4K/UHD which is primarily a resolution increase in its initial rollout but is planned to include upgrades in frame rate and colour.
The other side of the equation is the cost of transmission. This has two variables: the availability of a network or spectrum to deliver, and technologies to improve the efficiency of delivery over a given network. Network or spectrum availability is not entirely a technology issue. The construction of new internet pipes, more transmitter towers, or the launch of new satellites is rooted in commercial decision making guided by regulation. Likewise any reallocation of limited public resources, such as spectrum (for terrestrial, mobile or satellite use) is primarily regulatory with strong commercial guidance.
Demand for information transmission has generally increased year on year, the available capacity for all major platforms, be it for the internet or for video delivery. The most consistent trends are towards the reallocation of spectrum previously used for broadcast TV in either terrestrial or satellite to uses in mobile data. Elsewhere the bulk of investment has come in mobile data infrastructure and internet connectivity, including public Wi-Fi.
While network infrastructure changes and evolves, technologies are also developed to more efficiently utilise those networks. The three key technology considerations are how traffic is structured; how the network transmits traffic; and how that traffic is compressed or encapsulated for delivery.
The efficient use of any network is initially based on whether the network structure is appropriate for its use. Networks can be used to transmit signals either in one direction to the receiver, or bi-directionally to enable information back into the network. Broadcast networks are one direction only and this makes them very efficient delivering traffic to many people concurrently. A single signal can be sent out in a particular frequency, and all anyone has to do to receive it is tune into that frequency. This means a TV channel can be delivered to many millions of receivers by only being transmitted once, and therefore only taking up a small amount of available network and spectrum.
At the other end of the scale is a unicast network, typified by internet access. These are bi-directional networks where the user is able to make requests of the network, and the network then retrieves and delivers requested content to that user only. Unicast is a highly effective way to provision personalised and reactive services to a small number of concurrent users. The downside is that it is a very inefficient way to deliver the same content to many people in the same area at about the same time.
To provide a sense of scale, while around half of available internet traffic is used to stream video it only accounts for about 5% of viewing time. The extension to this is that current levels of video consumption cannot be distributed by the internet and won’t be for several years. However, content that is not viewed by many people (much of what is available on YouTube or Netflix) is more efficiently served by just allocating the cost of distribution upon request. Content that has mass, concurrent or new concurrent audiences, such as live sports, news channels and core broadcast channels are viewed by so many people that they are more efficiently delivered as mass broadcast, which can be redelivered to other devices using in-home hard disk and Wi-Fi. A final key point is that there is technology for utilising internet networks for broadcast delivery called multicast IP. However, much like any network it requires new transmission infrastructure and fits in and around the wider, unicast internet infrastructure already in place.
Any structure of network then requires some means of transmitting content over it. Part of this decision is predetermined by the network type – satellite, fibre, copper wires and terrestrial spectrum all have particular mechanisms that allow for information to be delivered over the network type. On top of these are layers that describe the efficiencies of that distribution, often in terms of how many different signals – or sets of 1s and 0s – can be simultaneously sent and how to reconstruct at the other end. Semiconductor technology as well as more efficiently delivery media (in particular light rather than electrons in the case of fibre) have enabled more information to move concurrently than previously. This has been driven primarily by digital technology, the means of sending data in discrete packets of 1s or 0s rather than along an analogue waveform. Digitisation requests technologies to ensure that each packet is properly represented – a 1 misrepresented as a 0 is very different to an areas with a slightly off-shade of blue. In general though, digitisation of all content has unified the delivery platforms such that everything, from the internet to video, is essentially just data. Future technologies will see this technical unification married with a more fluent interchange between different platforms, such that a satellite TV image can easily interface with internet content delivered over mobile, for example.
In a longer view this will include switching transmission mechanisms from one delivery platform to another based on current need and how efficient the delivery is. This could include switching users from unicast to broadcast or multicast or from fibre to satellite without the viewer being aware, or embedding broadcast video into websites or web content into broadcast streams. This could result in advanced personalisation of content and advertising unifying the current silos of internet and TV.
The final technology to determine efficiency of delivery is compression and encapsulation. Compression most typically applies to video because raw, uncompressed video is so high-bandwidth. The live HD feed out of a sports stadium is transmitted at 300 Megabits per second (Mbps). This is the equivalent of 50 broadcast channels, over 100x the fastest typical online video speed available for any duration of viewing, and there is no way to get that much information to a TV using an HDMI cable. Since video is so data intensive compared to other applications there have been ongoing global efforts to create video compression standards. These take a video and exclude the superfluous information in a systematic manner. The most well-known group of standards are MPEG-2, MPEG-4 (also known as AVC or h.264) and HEVC (h.265), but there are many more in existence. Regardless of network type, network structure or transmission mechanism, compression reduces amount of data, and therefore traffic, required for video delivery while attempting to retain quality.
Current compression mechanisms are able to compress that 300Mbps stream into around 10Mbps with limited reduction in visual quality. However, with more powerful computer processing on more consumer devices the opportunity to further improve upon compression is still available. Advanced computing happens to coincide with an important regulatory moment as many of the original digital video compression patents created for MPEG-2 in the 1990s are now expiring. Already new compression standards are being created taking advantage of this, meaning future video efficiency improvements are coming.
Delays in the Digital Transition in developing countries
The transition of terrestrial TV broadcasting from analogue to exclusively digital is a major technological feat. Furthermore, the transition can have a considerable impact on the cultural and political landscape of a country since digitization brings a multitude of free to air channels, allowing more access to content for consumers via the television medium as well as providing more opportunities for broadcasters to grow their offerings. Digital transition is a multidimensional task requiring decisions to be made on a great number of political, social, economic and technological issues.
The International Telecommunications Union (ITU) set a deadline for the implementation of analogue to digital switchover by its member-states of 17 June 2015. ITU stated that this transition period can be extended up five years only for the benefit of some developing countries. So far all developed countries (with the exception of Russia) have managed to shut off analogue terrestrial TV signals well before the deadline. The vast majority of developing countries, on the other hand, in Sub-Saharan Africa, Asia Pacific, South and Central America and the Middle East and North Africa are likely to miss the first deadline. Some of the reasons for the delay in implementing the switchover are discussed in the following paragraphs.
For broadcasters, network operators and consumer electronics manufacturers, addressing the requirements of digital transition is a costly enterprise. However, the viewer also bears a considerable part of the cost through the purchase of new equipment (a DTT set-top box, sometimes a new TV aerial) or through installation costs. The costs involved with digital transition are not insurmountable for a TV viewer living in a developed country, but they may constitute a significant portion of the disposable income of a family living in a developing country. For instance, the South African government has calculated that roughly 40% of the country’s population cannot afford the purchase of a DTT set-top box.
Another factor impeding the fast roll-out of the switchover relates to labour resources. For instance, many Sub-Saharan African countries do not possess sufficient numbers of trained technical personnel like electronic engineers, DTT network technicians, or TV aerial installers needed to drive the DTT uptake. Some governments in developing countries lack the funds to promote this, which in some cases has led to the outsourcing of DTT network roll-outs to foreign companies like the China-based StarTimes.
Implementing the switchover also requires the coordination of many parties, from government departments and regulatory agencies to broadcasters, network operators, consumer electronics manufacturers and even social institutions and charities. Developed countries had successfully managed this by creating specific purpose bodies, which allow for a smoother transition process, such as Digital UK in the United Kingdom. Most developing countries have not created similar bodies or organizations, which further slows the digital transition process.
Another delaying factor is the selection of a digital transmission broadcasting standard. Some developing countries were faced with a choice between the European (DVB-T) and the Japanese (ISDB-T) standards, especially taking into account the offers made by both parties. A prime example is South Africa, which initially favoured the adoption of the European DVB-T. However, in 2010 political favour turned to the Japanese standard; before the country decided adopt the newest European standard (DVB-T2) in 2011, after a cabinet re-shuffle and the removal of the former Minister of Communications.
Low TV household penetration of a terrestrial platform can also lead to a delay in digitisation. For example, in the Middle East and North Africa more than 90% of the TV households rely on the satellite platform, while in Asia-Pacific the primary penetration of cable and satellite TV is four to five times that of terrestrial. As a consequence, governments in these regions consider digital transition as a less urgent priority since a small minority of TV households will be affected. In addition, if a neighbouring country delays digital transition, a government’s incentive to shut off analogue terrestrial TV may decrease, due to the reduced risk of interference between analogue transmissions of one country and digital transmissions of a neighbouring country. This has occurred in Sub-Saharan Africa, for instance.
In many developing countries broadcasters do not have the financial resources to support the switch to digital, and are placing pressure on governments to delay the whole process. Governments however may seek to promote domestic production of DTT TV equipment via blocking imported receivers, raising import duty taxes or requiring domestic-only production of equipment. This policy results in further delays to the switchover process if the local manufacturing industry does not have the necessary resources to start producing the equipment.
In the case studies that follow we will examine some of these issues in greater depth.

